The GitOps dashboard
In the previous section we have briefly seen the GitOps dashboard offered by Codefresh in order to find out the public IP of the deployed application. In this section we will see some more details of the dashboard and more specifically the traceability if offers from production to commit
Getting visibility into your deployments
The GitOps dashboard has 3 tabs
- Timeline
- Kubernetes services
- Current status
The Timeline tab has a complete history of your deployments in chronological order. You can also use the optional integration with JIRA in order to get information on which JIRA features are included in each deployment. We will use this screen in the next sections to perform rollbacks in our application.
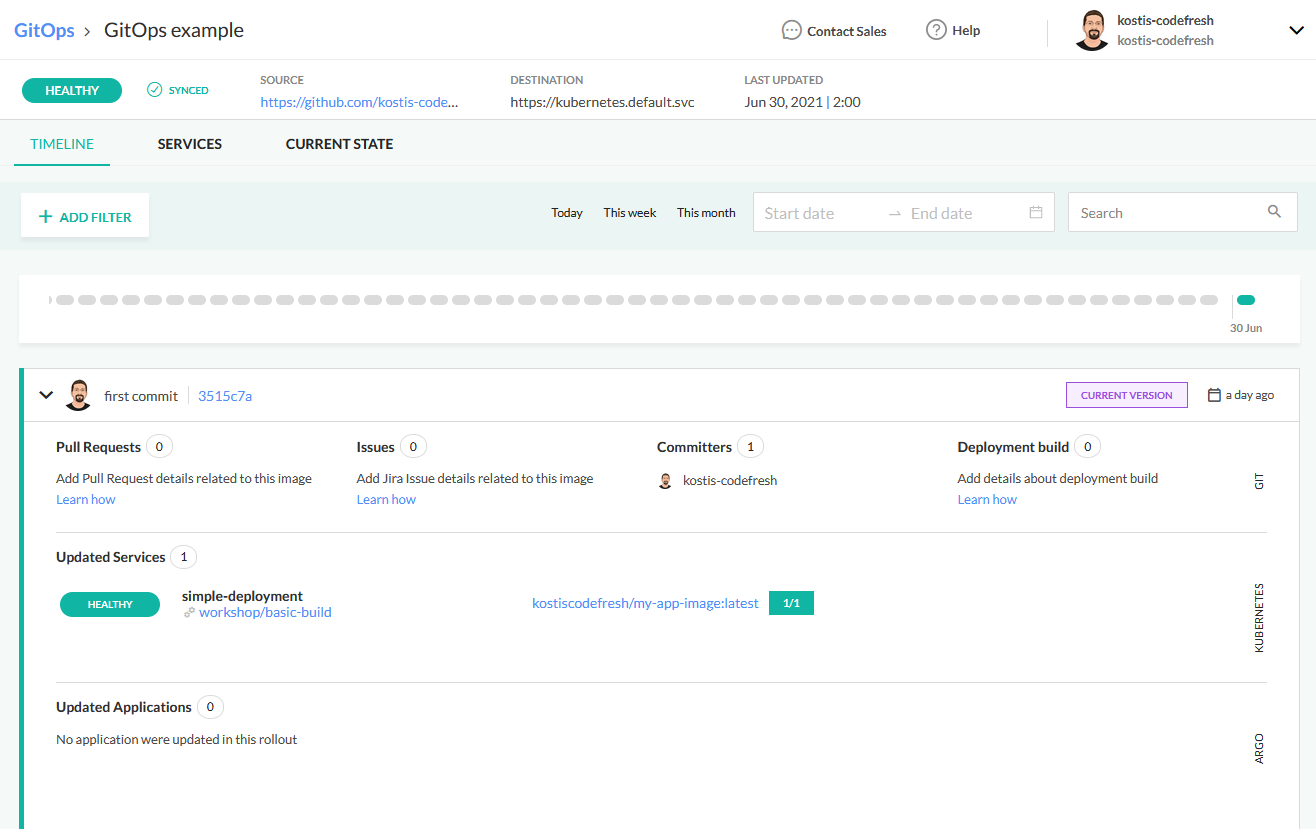
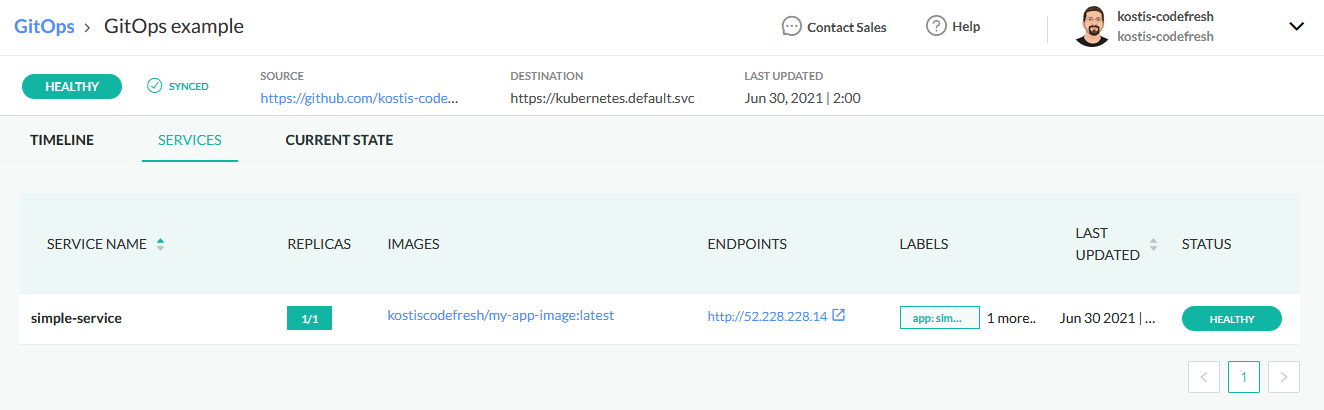
The Services tab shows the Kubernetes services/deployments included in your application and is very important for tracing your release all the way back to source code as we will see in the next section.
Finally the Current State tabs shows a live overview of the Kubernetes resources in your cluster. It follows a hierarchical pattern with clear dependencies between the different resources.

Using the GitOps dashboard can quickly answer questions such as who deployed, which features and when.
Using the GitOps dashboard as a single pane of view
The GitOps dashboard offered by Codefresh is one of a kind because it centralizes in a single view several pieces of information without the need to hunt them down in other dashboards.
Out of the box you get the following:
- A history graph with success/failures and time filters
- A history of all GitOps deployments in a reverse chronological order
- Several links on each deployment event that point back to the pipeline responsible for this deployment and the Git hash that triggered it.
- Pull request information in the case of pull request events
- A clear view on which Kubernetes services were touched by this deployment.
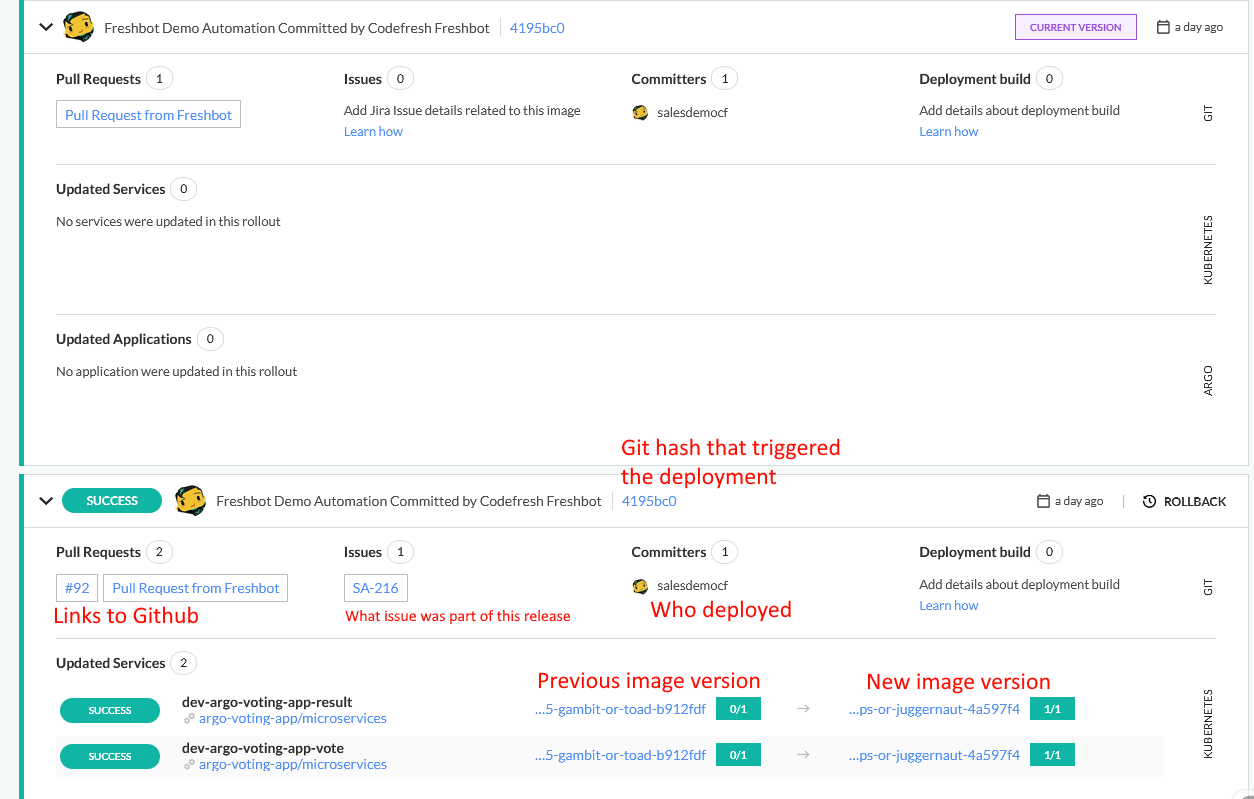
With the optional Jira integration you also get to see which features were actually part of the deployment. This is a great advantage for product managers and product owners because now you can instantly answer questions such as “What was deployed now in production?” or “Which environment contains feature X?”.
By clicking on any image in the previous or updated services section you can go back to the image dashboard of Codefresh. The Codefresh image dashboard shows the metadata for this container including its complete history. From the top navigation choose the Logs tab.

In the new screen you will see which pipeline build created this image. Here you can have multiple options. You can click on the pipeline name at the top to edit that pipeline.
But most importantly you can click on the name of the commit message.
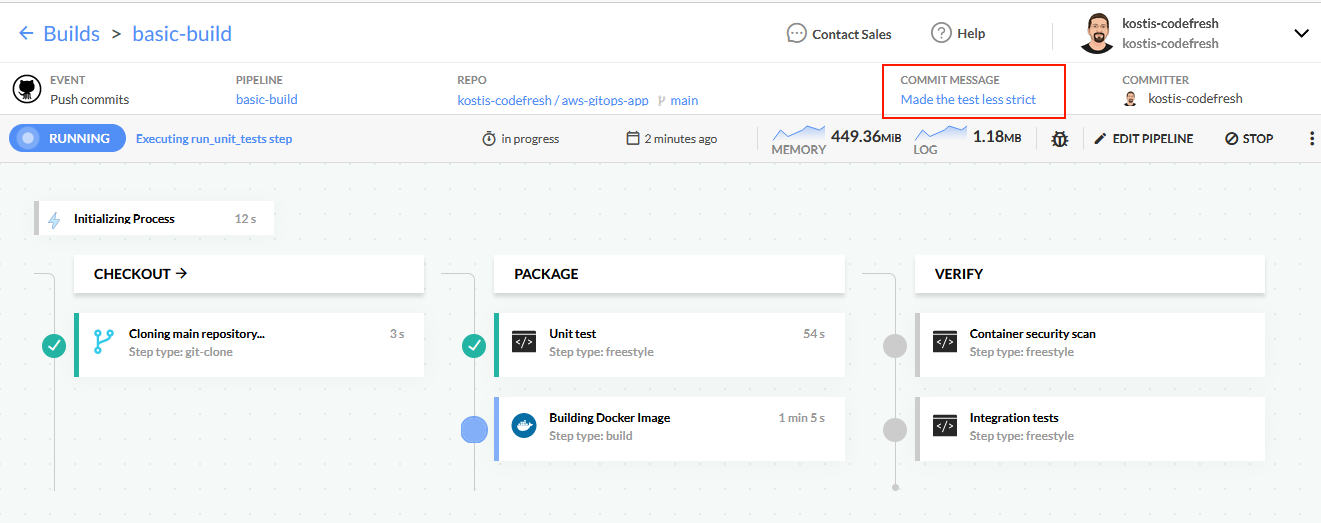
The final click will take you to Github (or any of the supported Git providers) and show the exact commit that was used as an input to the pipeline (and therefore the source of the container image).
This way you can also go from a deployed image back to the source code. This journey is only possible with Codefresh because Codefresh has visibility into both the CI and the CD part of the process.
You can go to the Git hash view and the pipeline view right from the GitOps dashboard as well.